The Delta Issue #24
NAEP Beyond the Headlines
By: Jessica Baghian
On Monday, Chad Aldeman and I held a webinar to discuss the data and share our key takeaways. If you missed it and want the replay, you can watch the recording here.

Graph courtesy of Chad Aldeman.
The graph above tells a surprising story: Academic achievement scores peaked in the U.S. around 2013. There are many theories about why achievement declined throughout the 2010s, but we know for certain that the decline was steepest for students in the lowest-achieving 10th percentile. After achievement plunged in 2020 due to COVID-19 disruptions, the highest-achieving students (in the top 90%) bounced back while the lowest-achieving students (in the bottom 10%) continued to plunge.
The NAEP scores released last week gave us the second national snapshot of how student achievement has changed since the pandemic. It not only revealed a decline in scores since 2022, but also an entrenched gap between the 90th and 10th percentiles.
Unless you’re a classroom teacher or a K-12 assessment junkie, you might not know what it means for fewer than 4 in 10 4th graders to be able to correctly answer a basic multiplication problem, or for only 6 in 10 to correctly answer a basic reading comprehension question.
But there is a very concrete performance gap between the highest 90th percentile and the lowest 10th that will determine what opportunities students have when they reach adulthood — and this brings the urgency of the challenge into sharp focus.
Want to understand the 90/10 split where you live? Our NAEP analysis dashboard makes it easy for you to analyze it. Click here to view the dashboard.
What the Bright Spots Tell Us
Even though the gap between the highest- and lowest-performing students is the thing that keeps us up at night, it’s not inevitable. For example, Mississippi improved its average score for the 10th percentile over the last decade — and by 9 points, while the national average declined by 15 points.

Mississippi isn’t just outperforming others with its lowest performers; it is outperforming much of the country overall. The same is true in D.C. and Louisiana. Their progress isn’t because their demographics are changing and becoming wealthier (in fact, if anything, it’s quite the opposite), and they’re not just improving relative to other states on the decline.
Despite being among the poorest states in the nation, Mississippi and Louisiana are now tied for 14th in overall 4th-grade reading. These states serve students with some of the greatest needs and have a long history of academic struggles, and yet they now outperform the vast majority of states with more resources and arguably fewer challenges. These states improved because they maintained consistent, evidence-based instructional practices year after year, for every student.
What We Can Learn from the States Doing It Right
While many things influence NAEP scores and statisticians will caution against claiming causality, it stands out to me that the leading states all have a long history of strong state education agencies with these five things in common:
- A sustained focus on core academics over the long haul. They prioritized a narrow set of things and, importantly, deprioritized other things. They did not take on everything and they got less distracted by the noise in education. It’s not flashy to focus on core academics, but that’s what we have to do.
- Alignment of carrots and sticks with their main priority. They aligned accountability, funding, and other levers of the state to build momentum against their priority areas.
- Attention to policy implementation down to the classroom level. D.C., Louisiana, and Mississippi sustained their focus on the implementation chain, and determined what their SEAs needed to do differently to get thousands of adults in these education systems — teachers, principals, and district leaders —to make adjustments in their day-to-day on behalf of kids.
- Passing a policy is just the starting line. Too often, there’s a big celebration when a bill is signed and then attention fades when it comes time for implementation, and that’s a big mistake. Take a look at this graph of states who have passed science of reading bills, for example.
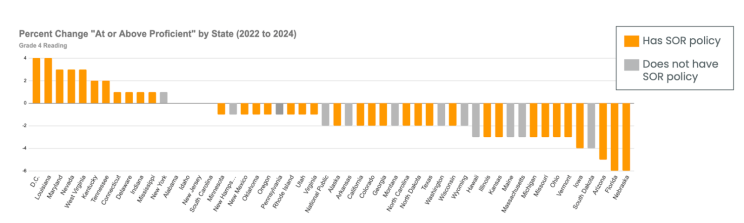
What I take from this is not that science of reading legislation doesn’t work, but that it will take time for these bills to impact millions of classrooms at scale — and that will only happen if we are intentional and stick with it.
- Honest assessments of student performance. There are a lot of states in this country that put out assessment results that tell parents everything is fine, when, if we believe the proficiency bar of NAEP, everything is not fine. We call this an honesty gap. However, when D.C., Louisiana, and Mississippi put out state test results, proficiency on their state tests is as or more rigorous than proficiency on the NAEP.
Want to hear Chad and me talk about this in more depth? Watch our webinar, “NAEP Beyond the Headlines,” here. Let’s build on these lessons. Let’s scale what works. And let’s stay committed to the hard work of sustained implementation — so that every child has the opportunity to thrive in the classroom and beyond.
Thanks to Chad Aldeman and Jill Zimmerman Pinsky contributing to this newsletter. Follow Chad’s Substack, Alderman on Education, here.
Let’s Get Muddy
Have questions about your state’s data? Our interactive NAEP dashboard has been updated to help you explore longitudinal trends and compare state-by-state performance over the last decade. Drop your questions in the comments!
For more analysis, check out Chad’s most recent article in The 74, where he explores the broader implications of these test scores: Across All Ages & Demographics, Test Results Show Americans Are Getting Dumber.